Abstract
Within the realm of financial lending, the FICO score has long served as the primary tool for assessing potential borrowers. Recognizing the limitations of traditional FICO scores, which rely heavily on credit history and may disadvantage first-time applicants, we propose the use of cash scores as an alternative metric. That is, leveraging the capabilities of machine learning alongside borrowers' transactional data to forecast the likelihood of customer default. Specifically, income, balance, and transaction category emerge as pivotal factors correlated with credit risk for each individual. This project aims to construct a model that integrates all these features and combinations therein to anticipate whether a customer is likely to default on their banking transactions.
Introduction
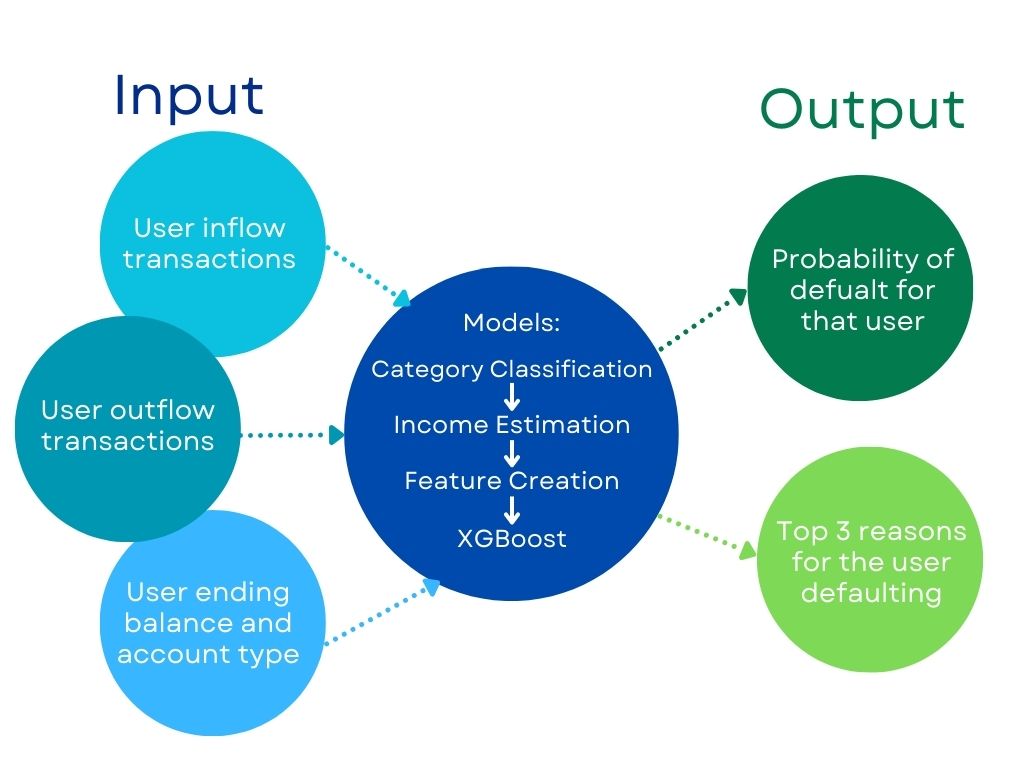
In today's dynamic economic landscape, financial institutions strive to broaden their customer base while managing risk prudently. Credit risk analysis presents a challenge despite access to extensive user data, due to the complexity of data structures. Traditional FICO scores, heavily reliant on credit history, may pose challenges for first-time applicants lacking such history. To address this issue, we propose the use of cash scores, derived from transactional data, as an alternative metric for assessing creditworthiness. This project focuses on combining customers' income, balance, and transaction category information to create predictive features for assessing default probabilities for each customer. To get the most accurate income estimation, we take into account all possibilities for paychecks by basing inflow on a given definition of regularity. For the balance feature, we calculate the cumulative balance sum, standardize these values and use the balance regression coefficients as well as moving averages. For the transaction features, we calculate the customer's percentage spent by both the inflow and outflow categories. Additionally, we also define a feature that correlates to the account type since different account type has different inflow and outflow amounts per customer. By further refining the important features, we use roughly the most important 40 features to put into the XGBoost model to predict the probability of a customer's default, along with the top three reasons why each user would default.
Methods
Our prediction model heavily depended on the features derived from the datasets. This section outlines the methodologies employed to generate these features, crucial for the efficacy of our predictive modeling framework.
Income Estimation
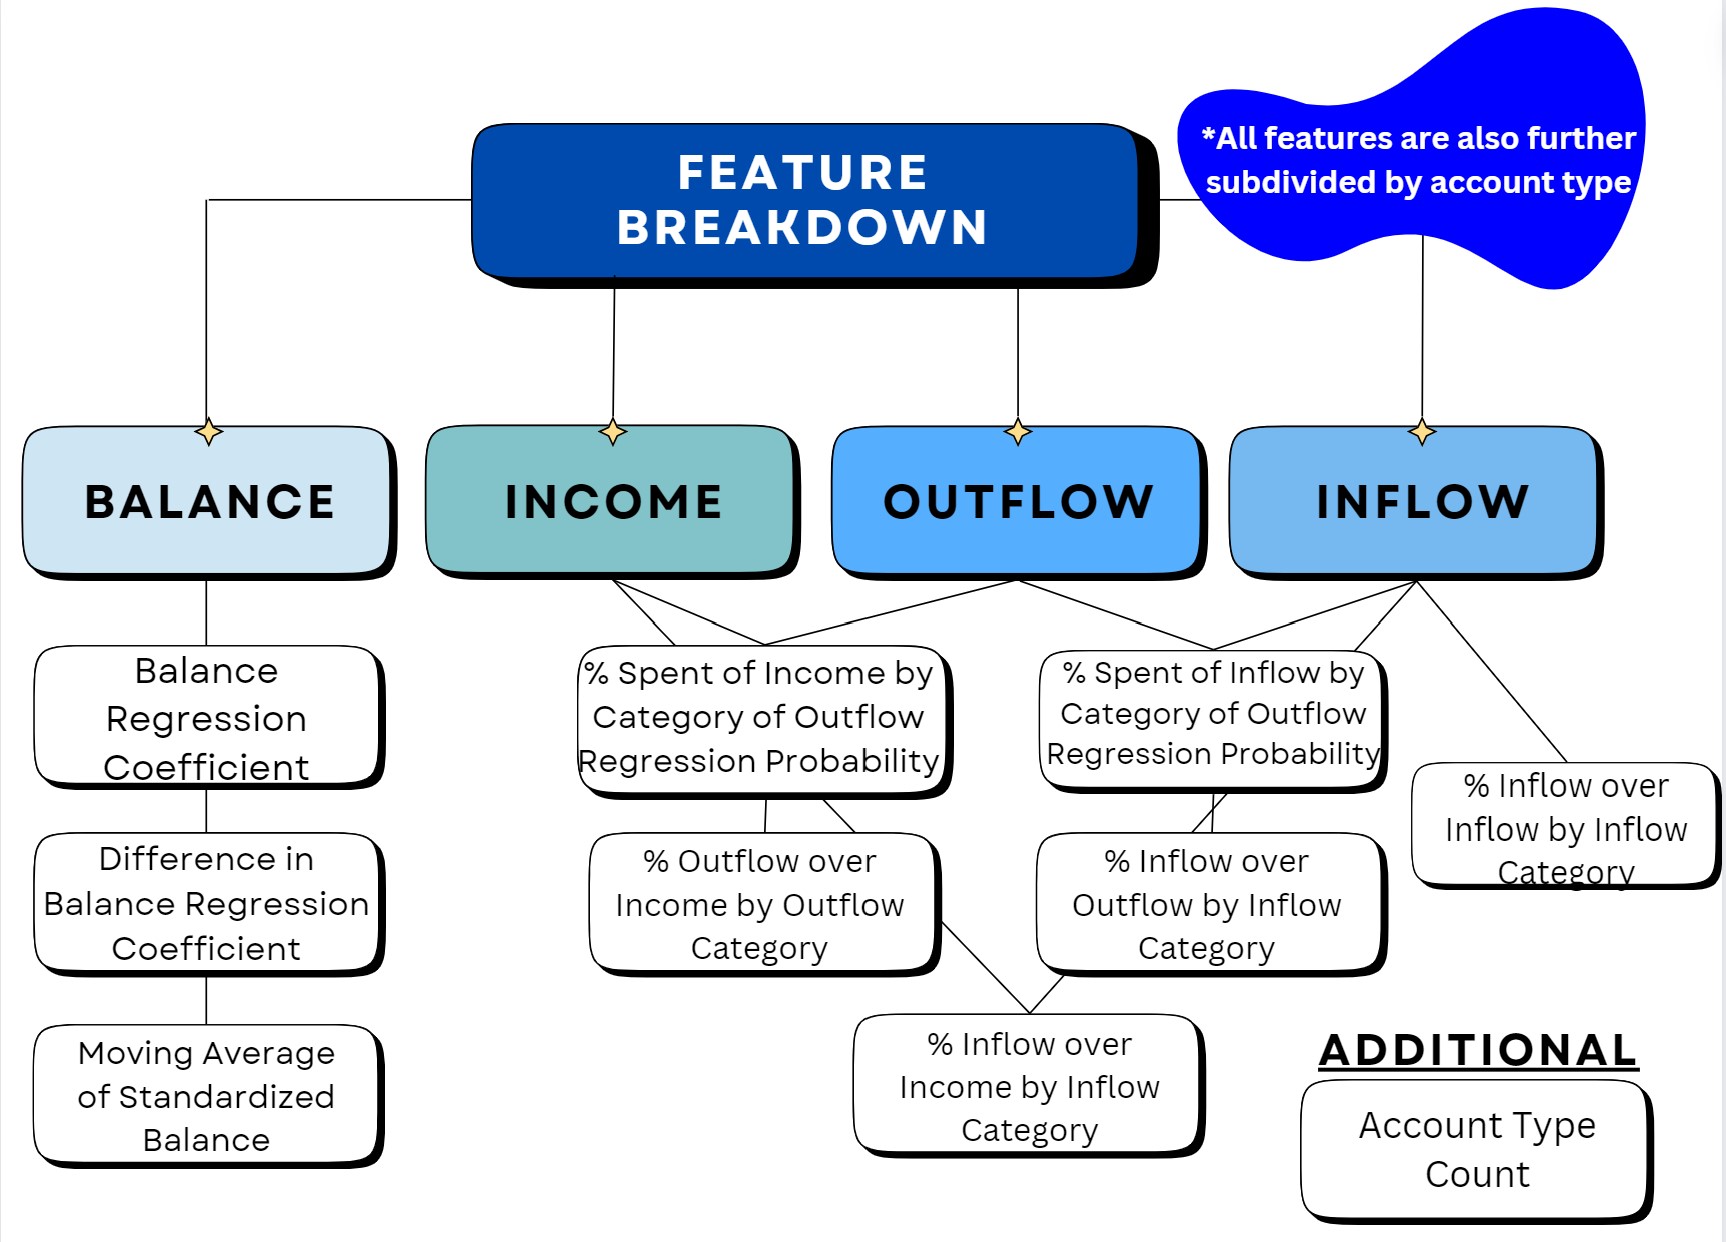
One component we knew we wanted to include in order to assess risk of default was income. We believed people with steady income were more less likely to default, but since this measure is not monitored, we needed to estimate it. Our estimate depended on:
Feature Creation
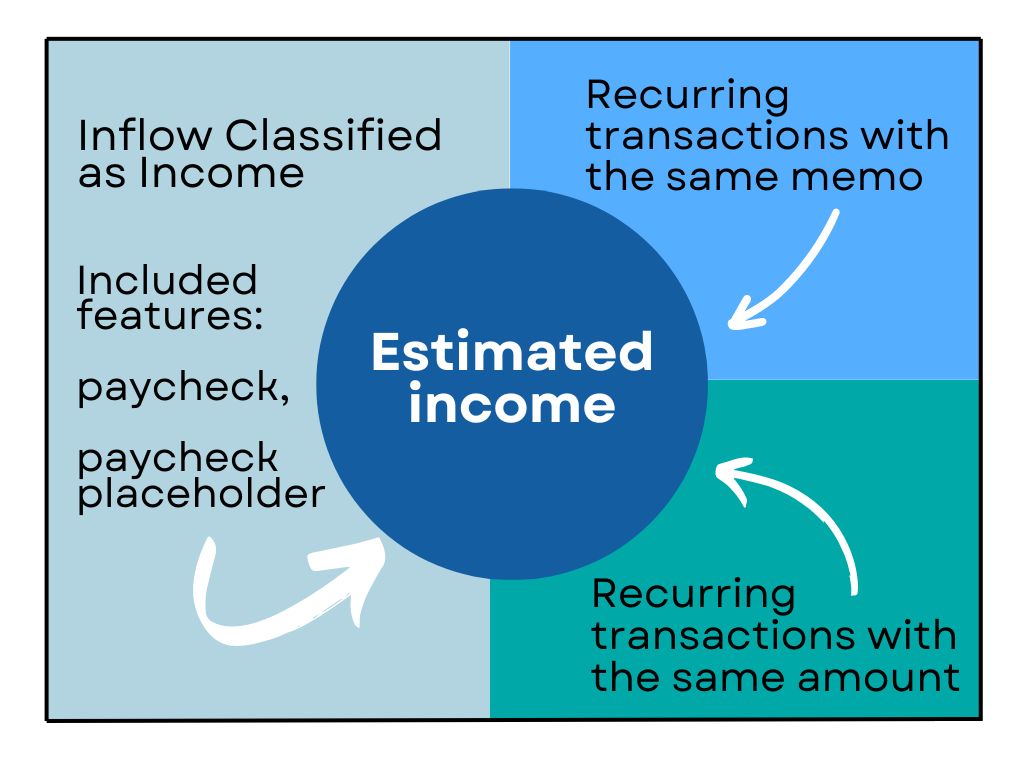
Nearly all our features can be categorized into four main types: balance, income, outflow, and inflow. Some features were derived from ratios between these categories, such as inflow-to-inflow category. This type of analysis aims to help explain trends in credit and debit proportions and their origins. Ratios not directly used were incorporated into a logistic regression model, where instead we utilized default probability as a feature. Another focus area was balance and its trends over time. Regression coefficients were calculated for balance and differences in balance, supplemented by moving averages to capture stable patterns. These features were designed to track changes in users' overall financial activity over extended periods. The final feature that does not fit into the aforementioned categories is account type count. Below is a list of all the features we used in our model, along with their descriptions and suffixes:
Feature Selection and Models
In refining our feature set for optimal model performance, we started with 132 features and streamlined them using exclusion criteria to remove bias-related features, such as those involving sensitive healthcare information. We assessed the importance of the remaining features differently for each model: logistic regression and SVM models were evaluated by their coefficients, while XGBoost used its feature importance function. Through cross-validation and iterative analysis, we identified and retained the most impactful features, enhancing the model's predictive capability.

-
Logistic Regression
- The Logistic Regression serves as our baseline for predicting customer default outcomes, chosen for its aptness in binary classification tasks and flexibility across various types of independent variables. Feature selection is performed as described earlier, followed by model training and evaluation on a stratified train-test split to assess performance metrics like accuracy and AUC score.
Support Vector Machine
- We then explore the Support Vector Machine (SVM) model, recognized for its proficiency in high-dimensional spaces, such as text classification. The approach mirrors that of Logistic Regression, focusing on feature importance for model training and performance evaluation.
XGBoost
- We focus on XGBoost, celebrated for its prowess with complex datasets and high accuracy across diverse data types. This makes it an excellent choice for our default prediction task. Our approach with XGBoost mirrors earlier models, starting with feature selection guided by the model's feature importance. We then train and evaluate XGBoost on the selected features, using metrics like accuracy, AUC score, and classification reports for performance assessment.
Results
| Metric | Definition | Formula |
|---|---|---|
| Precision | Measures the percentage of predictions made by the model that are correct. | |
| Recall | Measures the percentage of relevant data points that were correctly identified by the model. | |
| F1 Score | Harmonic mean of precision and recall. | |
| Support | Number of actual occurrences of each class in the dataset. | N/A |
| Accuracy | Measures the number of correctly classified instances over the total number of instances. | |
| Macro average | Average of metrics across all classes, treating each class equally. | N/A |
| Weighted average | Average of metrics across all classes, weighted by support. | N/A |
Model Performance
Logistic Regression
| precision | recall | f1-score | support | |
|---|---|---|---|---|
| 0 | 0.82 | 0.99 | 0.90 | 798 |
| 1 | 0.63 | 0.09 | 0.16 | 185 |
| accuracy | 0.82 | 983 | ||
| macro avg | 0.73 | 0.54 | 0.53 | 983 |
| weighted avg | 0.79 | 0.82 | 0.76 | 983 |
Support Vector Machine
| precision | recall | f1-score | support | |
|---|---|---|---|---|
| 0 | 0.88 | 0.93 | 0.90 | 798 |
| 1 | 0.00 | 0.00 | 0.00 | 185 |
| accuracy | 0.81 | 983 | ||
| macro avg | 0.41 | 0.50 | 0.45 | 983 |
| weighted avg | 0.66 | 0.81 | 0.73 | 983 |
XGBoost
| precision | recall | f1-score | support | |
|---|---|---|---|---|
| 0 | 0.81 | 1.00 | 0.90 | 798 |
| 1 | 0.59 | 0.44 | 0.50 | 185 |
| accuracy | 0.84 | 983 | ||
| macro avg | 0.73 | 0.68 | 0.70 | 983 |
| weighted avg | 0.82 | 0.84 | 0.83 | 983 |
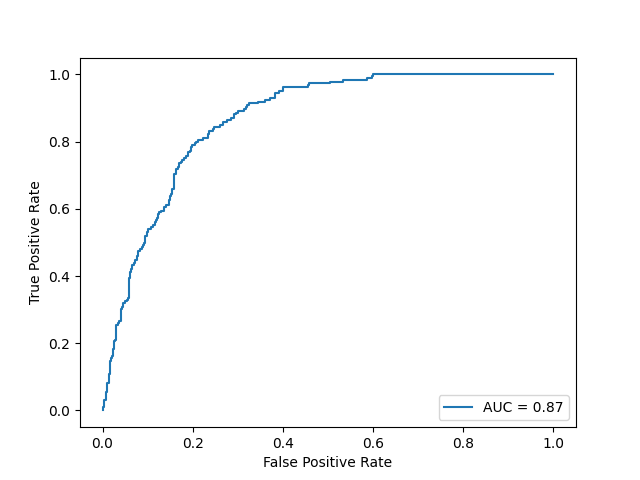
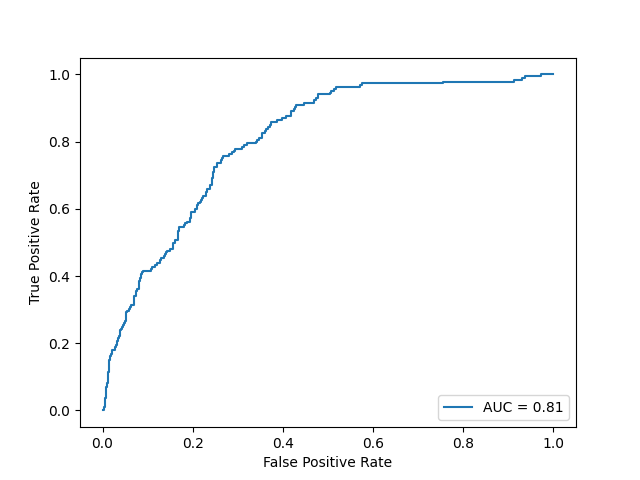
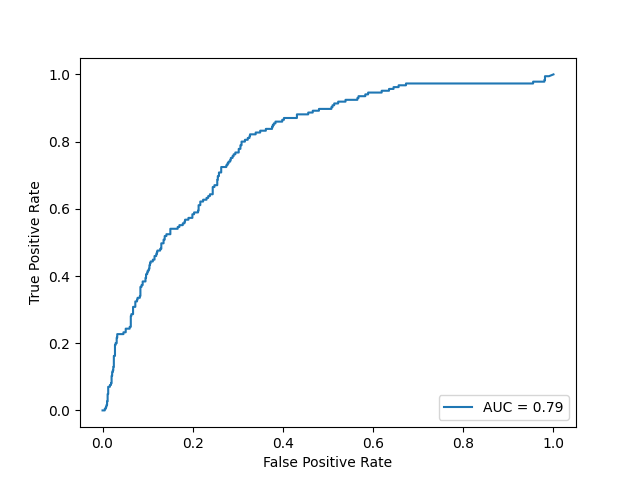
Based on the results of our three models, all the accuracy scores of our models reached 80 percent or higher, indicating the models are performing well across both classes. This means that for a given set of data, our models can correctly identify whether a customer will default or not 80 percent of time. Additionally, based on the AUC score, the xgboost model has the best result. An AUC score, or Area Under the Receiver Operating Characteristic (ROC) Curve, of 0.87 indicates a high level of model performance in distinguishing between the positive class (e.g., customers who will default) and the negative class (e.g., customers who will not default). So there is an 87 percent chance that the model will be able to distinguish between a randomly chosen positive instance and a randomly chosen negative instance. This is considered to be a very good performance, indicating that the model has a high likelihood of correctly classifying customers who will default on loans versus those who will not.
Model Output
-
Default Probability
- We assign each consumer a probability of default score from 0 to 1. The closer to 1, the more likely the consumer is to default.
-
Reason Code
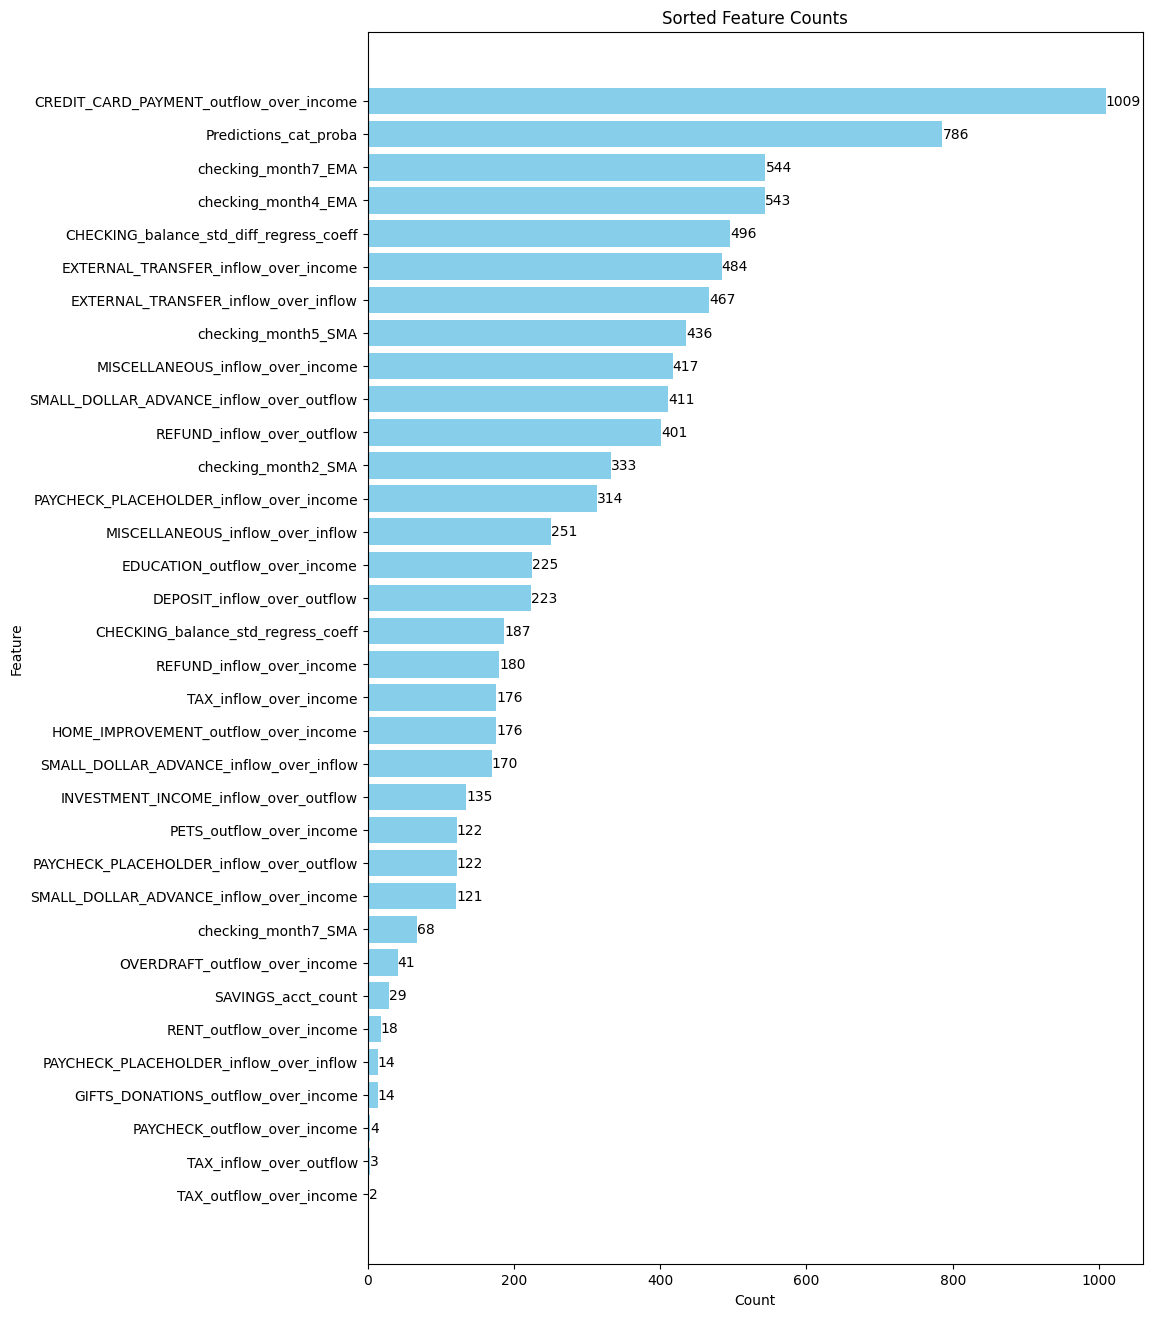
- We also provide the top 3 reasons why any given candidate
might raise concerns for defaulting based on the model. Here is the count of the most common reasons for defaulting:
- We also provide the top 3 reasons why any given candidate
might raise concerns for defaulting based on the model. Here is the count of the most common reasons for defaulting:
Discussion
The model's performance in predicting class 1 is suboptimal, with precision, recall, and F1-score values of 0.59, 0.44, and 0.5, respectively. This limitation stems primarily from two factors: the composition of the data and the inherent characteristics of the model. In our training dataset, more than 80 percent of customers belong to class 0 (non-defaulters), while less than 20 percent are in class 1 (defaulters). Consequently, the model tends to prioritize optimizing precision and recall for class 0 at the expense of class 1.
Contributions Beyond
By leveraging transaction data from user accounts, we broaden the scope of potential borrowers we can cater to, all while striving for the most accurate distinction between sound and risky loans. Significantly, we also try to adhere to strict ethical standards, refraining from utilizing features that could lead to discrimination against protected classes. We also attempted to avoid indirect discrimination by normalizing and analyzing users' transaction histories against themselves. In summary, our model expands access to the market ethically, accommodating a broader range of users, while concurrently optimizing loan quality by emphasizing good loans and mitigating the risk of bad ones. Overall, our model promotes financial justice and ethical decision-making while guaranteeing inclusion without sacrificing the integrity of our lending operations.